Data Quality
The Data Quality framework is based on Great Expectations (GX) and other custom-made developments, providing a very light abstraction on top of the GX open source framework and the Spark framework.
How to use Data Quality?
Data Loader
You can define data quality rules inside the DataLoader algorithm that you use to load data.
The DataLoader algorithm allows you to store the results of the data quality checks inside your custom location using the result_sink options (e.g., a delta table on your data product). Using result sink unlocks the capability to store DQ results having history over all the DQ executions, which can be used for debugging, to create DQ dashboards on top of the data, and much more.
Examples:
In these examples, dummy sales local data is used to cover a few example usages of the DQ Framework
(based on Great Expectations).
The main difference between the sample acons is on the usage of dq_specs.
- 1 - Minimal Example applying DQ with the Required Parameters
- 2 - Configure Result Sink
- 3 - Validations Failing
- 4 - Row Tagging
Data Quality Validator
The DQValidator algorithm focuses on validating data (e.g., spark DataFrames, Files or Tables).
In contrast to the dq_specs inside the DataLoader algorithm, the DQValidator focuses on validating data at rest
(post-mortem) instead of validating data in-transit (before it is loaded to the destination).
The DQValidator algorithm allows you to store the results of the data quality checks inside your custom location using the result_sink options (e.g., a delta table on your data product). Using result sink unlocks the capability to store DQ results having history over all the DQ executions, which can be used for debugging, to create DQ dashboards on top of the data, and much more.
Here you can find more information regarding DQValidator and examples.
Reconciliator
Similarly to the Data Quality Validator algorithm, the Reconciliator algorithm focuses on validating data at rest (post-mortem). In contrast to the DQValidator algorithm, the Reconciliator always compares a truth dataset (e.g., spark DataFrames, Files or Tables) with the current dataset (e.g., spark DataFrames, Files or Tables), instead of executing DQ rules defined by the teams. Here you can find more information regarding reconciliator and examples.
Reconciliator does not use Great Expectations, therefore Data Docs and Result Sink and others native methods are not available.
Custom Expectations
If your data has a data quality check that cannot be done with the expectations provided by Great Expectations you can create a custom expectation to make this verification.
Before creating a custom expectation check if there is an expectation already created to address your needs, both in Great Expectations and the Lakehouse Engine. Any Custom Expectation that is too specific (using hardcoded table/column names) will be rejected. Expectations should be generic by definition.
Here you can find more information regarding custom expectations and examples.
Row Tagging
The row tagging strategy allows users to tag the rows that failed to be easier to identify the problems in the validations. Here you can find all the details and examples.
Prisma
Prisma is part of the Lakehouse Engine DQ Framework, and it allows users to read DQ functions dynamically from a table instead of writing them explicitly in the Acons. Here you can find more information regarding Prisma.
How to check the results of the Data Quality Process?
1. Table/location analysis
The possibility to configure a Result Sink allows you to store the history of executions of the DQ process. You can query the table or the location to search through data and analyse history.
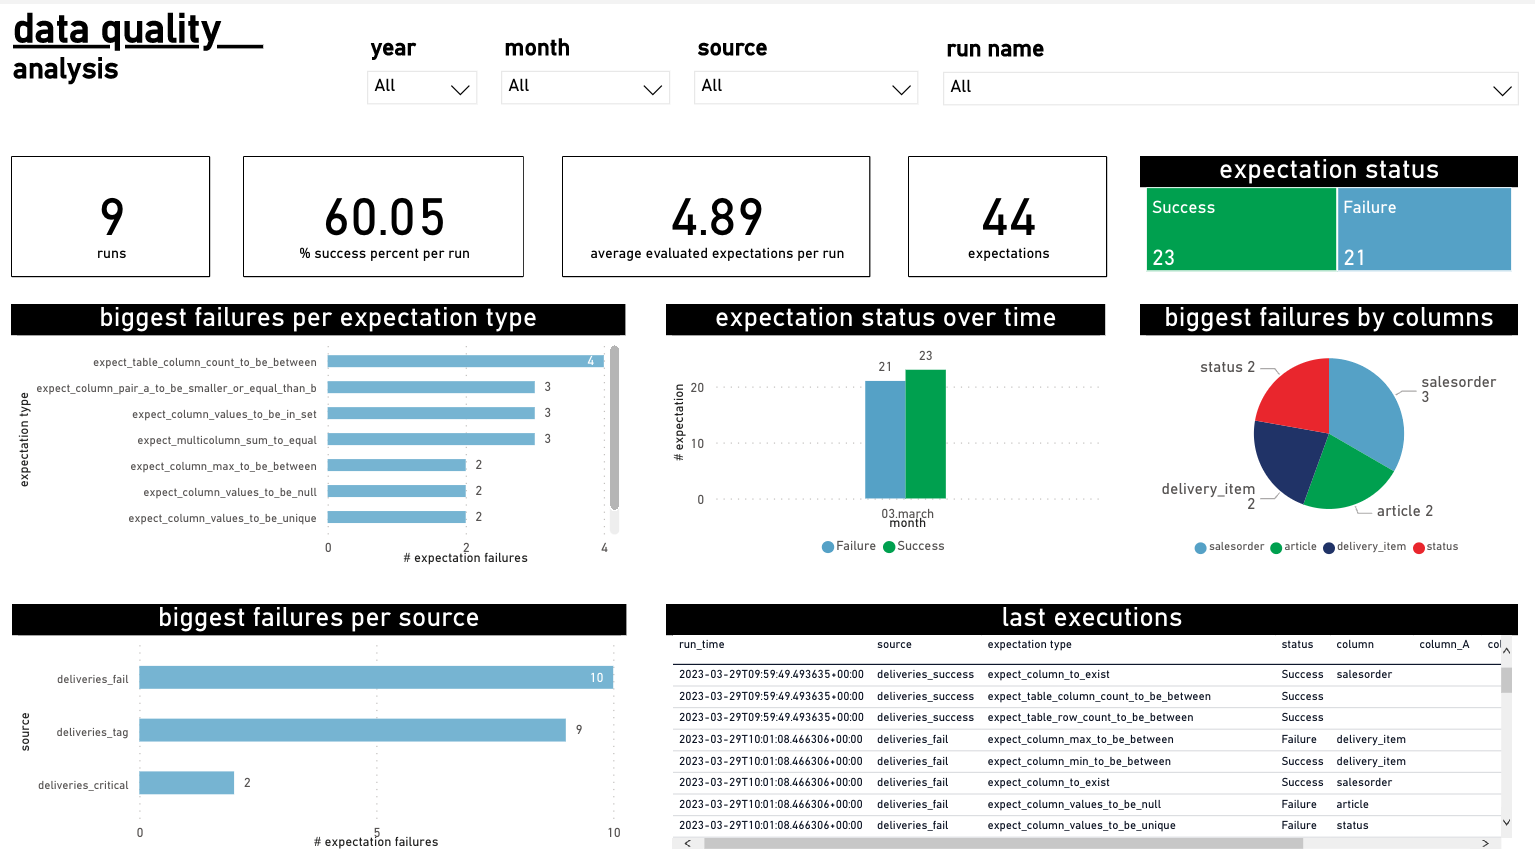
2. Power BI Dashboard
With the information expanded, interactive analysis can be built on top of the history of the DQ process.
A dashboard can be created with the results that we have in dq_specs. To be able to have this information you
need to use arguments result_sink_db_table and/or result_sink_location.
Through having a dashboard, the runs and expectations can be analysed, filtered by year, month, source and
run name, and you will have information about the number of runs, some statistics, status of expectations and more.
Analysis such as biggest failures per expectation type, biggest failures by columns, biggest failures per source,
and others can be made, using the information in the result_sink_db_table/result_sink_location.
The recommendation is to use the same result sink table/location for all your dq_specs and in the dashboard you will get a preview of the status of all of them.

3. Data Docs Website
A site that is auto generated to present you all the relevant information can also be used. If you choose to define
the parameter data_docs_bucket you will be able to store the GX documentation in the defined bucket,
and therefore make your data docs available in the DQ Web App (GX UI) visible to everyone.
The data_docs_bucket property supersedes the bucket property only for data docs storage.